In this article, we discuss liquid–liquid system in VisiMix and explain how we use Particle Vision Microscopy (PVM) PVM to calculate droplet size. For that we need the PVM droplet size to be matched to VisiMix in order to “calibrate” the model.
But first, some background and explanation what do we do and then it will be easier to understand how we use the VisiMix tools. We deal with transition chemical processes to the plant environment. We identify engineering challenges including heat transfer, mass transfer, and mixing and evaluating chemistry in the laboratory using in situ tools (IR, Raman, FBRM, PVM, heat flow). We also evaluate pilot and production equipment, and validate processes through scale-down experiments and develop low-cost chemical processes.
We have designed an automated laboratory reactor to replace the current lab system for the evaluation of raw materials in the production of propylene glycol dinitrate (PGDN) in order to maintain the same degree of mixing as traditional system PGDN is the main ingredient in Otto II fuel used in torpedoes. PGDN is manufactured in a continuous process and the nitration is highly exothermic and requires intimate mixing to avoid “hot spots.” It is also important to understand that a poorly mixed system can result in “fume offs.”
The reaction in mixed acid – Propylene glycol is added to a mixed acid (nitric and sulfuric), resulting in liquid PGDN with the light phase suspended in the heavy phase mixed acid. In the past, propylene glycol shipments have been contaminated with small amounts of impurity, resulting in poor separation in production equipment. The lab-scale nitration process was designed to mimic the same degree of mixing as a production nitrator to ensure that each shipment meets specifications, including separation time, before being used in the plant.
However, there are laboratory reactor constraints and that is why the main point of the automation process for us is to increase worker safety while maintaining the same degree of mixing and allowing for comparison back to historical data. The automation also allows us to detect droplet size, which may impact separation times, and also to identify problematic lots of propylene glycol. VisiMix allows us to match the mixing that we have in the current set-up to the desired one and to model both the existing and proposed lab reactors.
Simulant testing allows us to test the system with toluene/water and to make a direct comparison between the “existing” laboratory system and the “proposed” laboratory system. In this testing, the VisiMix inputs for the liquid–liquid mixing process include the interfacial surface tension between the two phases, the density of both phases, and the index of admixtures, which is a measure of the system to stabilize drops, electrolytes, surfactants, etc. At the end of the process, we’ll need the densities of the two phases, which were measured after the phases had been mixed and allowed to separate. With these inputs we can account for the change in density due to the solubility of the two materials with each other.
How to validate a model using PVM – Validation involves taking the PVM data at one set-up to test the model for the admixture value and comparing droplet size distribution to the VisiMix values. By matching the shear between systems, we can match droplet size, surface area, and mixing, and also the mean droplet size.
Advantages of VisiMix RSD
VisiMix RSD enables the rapid calculation of shear rates and stresses in the internal spaces of the high-shear mixer, pumping capacities and power consumption, and torque. VisiMix accurately predicts mixing parameters for both traditional impellers and rotor/stator systems for liquid–liquid mixing. By modeling dispersion in the historical laboratory equipment, you will be able to identify automated reactor configurations that will maintain the same degree of mixing and create the same hydrodynamic environment.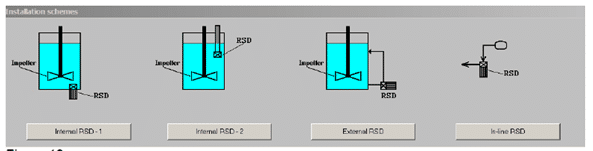
This article is based on Mr. Matthew Joergensen’s lecture on VisiMix International conference.